


SPX Monitoring Purposes: Long SPX 6/21/23 at 4365.69.
Long SPX on 2/6/23 at 4110.98: Sold 6/16/23 at 4409.59 = gain of 7.26%.
Monitoring Purposes GOLD: Long GDX on 10/9/20 at 40.78.
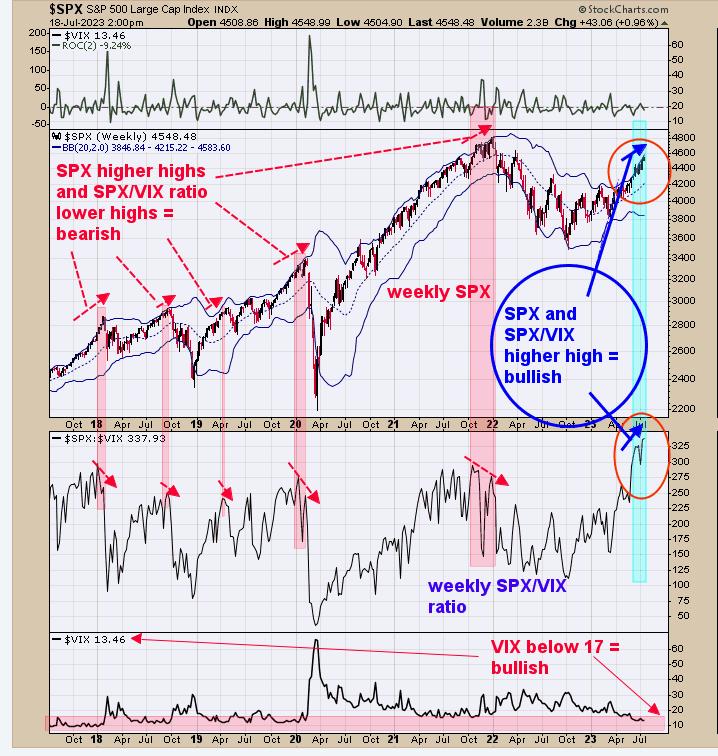
We updated this chart from yesterday, when we said, “The second window up from the bottom is the weekly SPX/VIX ratio. A bearish divergence develops when the weekly SPX makes a higher high and the weekly SPX/VIX ratio makes a lower high (noted in shaded pink). Currently, the weekly SPX has made a higher high along with the weekly SPX/VIX ratio, suggesting bullish divergence for the SPX. The bottom window is the VIX, and readings below 17 suggest the market is in a trending mode; today’s reading stands at 13.51 and remains bullish. Trend appears up for now.” Today’s VIX reading came in at +13.46. We are showing this chart again because the chart is relevant to what is going on in the market. Signs of a high are near when SPX makes a higher high and SPX/VIX ratio makes a lower high, and so far that has not happened.
If a bearish divergence is going to show up, the chart above may first to display it. So far, no significant divergence is present, suggesting the SPX rally can continue. We updated this chart from yesterday, when we said, “The middle window is the daily VVIX/VIX ratio with a 2-period moving average. VVIX responds faster to market movement than the VIX, and this ratio can responder faster when a market high nearing. So far, the SPX has made higher highs along with the VVIX/VIX ratio and, in turn, leans bullish. Last Friday, the TRIN closed at 1.46 and the TICK closed at -629, which is a bullish combination and suggests the market has panic in it to drive the SPX higher short-term.”
Above is a short-term view of what to expect for GDX. The bottom window is the GDX 18-day average of the Advance/Decline percent, and the next higher window is the GDX 18-day average of the up down volume percent. When both indicators are above -10 (noted in light blue), a rally in GDX is in progress. As long as both indicators remain above -10, the rally in GDX should continue. I’m on TFNN.com Tuesdays 3:30 and Thursdays at 3:20 Eastern Time, tune in.
Tim Ord,
Editor
www.ord-oracle.com. Book release “The Secret Science of Price and Volume” by Timothy Ord, buy at www.Amazon.com.
Signals are provided as general information only and are not investment recommendations. You are responsible for your own investment decisions. Past performance does not guarantee future performance. Opinions are based on historical research and data believed reliable; there is no guarantee results will be profitable. Not responsible for errors or omissions. I may invest in the vehicles mentioned above.