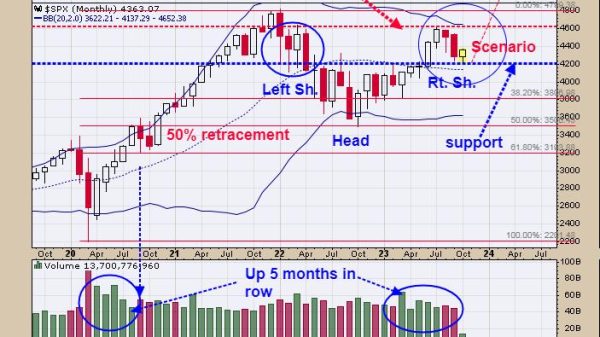
And just like that, the tech stocks are now in full distribution mode.
The bull market in stocks took a snooze to start the dog days of August, but that may be about to change, as a price trend transition with the potential for both profits and disappointments seems to be taking shape.
I’ve been bullish on the stock market since it forged a double bottom from October 2022 to January 2023. You can see for yourself here. More recently, however, I’ve been fretting about the rise in bond yields and its potential to disrupt the uptrend in stocks.
Thus I breathed a big sigh of relief when the July Nonfarm payrolls number came in below the 200,000 consensus number as bond yields throttled back their recently negative enthusiasm on 8/4/23. But, to be honest, my sigh didn’t last long, as the stock market delivered a negative intraday reversal despite the rally in bonds.
No, I’m not bipolar, although the market certainly is these days. The truth is that one of the major reasons we’ve been in an uptrend over the last few months is that bond yields have been in a mellow trading range between 3.2% and 4.1% on the U.S. Ten Year Note (TNX).
But even as bond yields fell on 8/5/23, the technology stocks, as I describe below, are under heavy selling pressure. This negative vibe could well spread throughout the whole market.
QQQ in a Short-Term Downtrend; Energy Takes the Reins
Money is rotating out the so called Magnificent Seven/AI/Microsoft (NSDQ: MSFT) axis and is moving to the energy patch as oil supplies continue to tighten.
Indeed, Microsoft has quietly broken below its 20-day moving average. And given the action in the Accumulation/Distribution (ADI) indicator, short sellers are starting to smell blood in the water. In fact, Microsoft’s weakness has influenced the price action in the Invesco QQQ Trust (QQQ), which recently failed to move back above its 20-day moving average despite a big rally in Amazon.com (AMZN).
QQQ may remain under pressure in the short term, as both Accumulation/Distribution (ADI, increasing short sales) and On Balance Volume (OBV, buyers turning into sellers) have also rolled lower.
Meanwhile, the iShares U.S. Oil & Gas Exploration & Production ETF (IEO) moved decidedly higher as this week’s U.S. EIA oil draw of 17 million barrels may lead to a more serious supply crunch soon. This view is supported by the steady downward pace in the weekly oil rig count. Certainly, a pullback to the 200-day moving average in IEO is possible after the recent gains. But, unless something changes, such a pullback is likely to be a great dip-buying opportunity.
So, as I asked here last week; is it time to sell the tech rally? What should you do with your energy holdings? And what about the homebuilder stocks and the REITs?
The model portfolios at Joe Duarte in the Money Options.com, updated weekly, and via Flash Alerts as needed, are full of tech, homebuilders, energy stocks, and REITs. You can have a look at all of them and my latest recommendations on what to do with each individual pick FREE with a two week trial subscription. And for an in-depth review of the current situation in the oil market, homebuilders and REITS, click here.
Triple Top in Bond Yields May be Forming; Could a New Up Leg in Housing be Near?
Volatile bond trading continued this week, as the U.S. Ten Year note yield (TNX) moved back inside the broad trading range it’s been locked in for the past few months. On the upside, TNX has tested the upper edge of the range between 4.1 and 4.2% three times since October.
Time will tell, but it is certainly a possible triple top. If that’s the way things work out, it may be bullish for stocks, especially interest-sensitive stocks and stocks in sectors where supplies are tight, such as homebuilders and REITs.
As the chart above shows, the most recent move took TNX above 4.1%, while the previous two moves in this trading period were at 4.2 (March 2023) and 4.3% (October 2022) respectively.
Here’s why the action in bonds matters to stock traders.
The downside reversal in TNX spawned an upside reversal in the homebuilder sector. The SPDR S&P Homebuilders ETF (XHB) rebounded after finding support at its 20-day moving average. And while this is a short-term positive, I’d like to see some confirmation from the Accumulation Distribution (ADI) and On Balance Volume (OBV) indicators before turning fully bullish on the sector again.
Details on what I’m doing with the homebuilders can be found here. But, if these positive changes are not reversed in the next few days, we may be nearing another up leg in the homebuilders.
On the other hand, the REITS (real estate investment trusts) did not react as positively to the news. The iShares U.S. Real Estate ETF (IYR) is testing its 50-day moving average. OBV suggests buyers are turning into sellers. That’s because REITS are much more sensitive to higher interest rates. As a result, I remain a bit more cautious on the REITs than the homebuilders.
NYAD Wobbles; NDX in Full Distribution Mode
The long-term trend for stocks remains up, but the short-term trend is suddenly wobbly. The New York Stock Exchange Advance Decline line (NYAD), is testing the support of its 20-day moving average even as it remains above its 50- and 200-day moving averages.
The Nasdaq 100 Index (NDX) resumed its short-term down trend last week after support at its 20-day moving average gave way. Meanwhile ADI and OBV are both pointing down as short sellers move in and buyers move out. This is a full-fledged distribution signal. ADI seems to have carved a short-term bottom while OBV is heading lower. This suggests that sellers are overtaking buyers even as short sellers are less active. Support is now at 15,000.
The S&P 500 (SPX) has broken below 4500 and its 20-day moving average. While ADI is negative, as short sellers move in, OBV has not fully broken down. SPX is holding up better than NDX because the energy and homebuilder sectors are showing some relative strength. Support is now around the 4400 area.
VIX Turns Up
I’ve been expecting a move higher in VIX, and it seems to have arrived as the index finally moved above the key 15 resistance level. This is a negative development for stocks, especially in the context of the bearish action in NDX.
When the VIX rises, stocks tend to fall, as rising put volume is a sign that market makers are selling stock index futures to hedge their put sales to the public. A fall in VIX is bullish, as it means less put option buying, and it eventually leads to call buying, which causes market makers to hedge by buying stock index futures. This raises the odds of higher stock prices.
Liquidity Remains Stable
Liquidity is stable, but may not remain so for long if the current fall in stock prices accelerates. The Secured Overnight Financing Rate (SOFR), which recently replaced the Eurodollar Index (XED) but is an approximate sign of the market’s liquidity, just broke to a new high in response to the Fed’s move. A move below 5.0 would be more bullish. A move above 5.5% would signal that monetary conditions are tightening beyond the Fed’s intentions. That would be very bearish.
To get the latest information on options trading, check out Options Trading for Dummies, now in its 4th Edition—Get Your Copy Now! Now also available in Audible audiobook format!
#1 New Release on Options Trading!
Good news! I’ve made my NYAD-Complexity – Chaos chart (featured on my YD5 videos) and a few other favorites public. You can find them here.
Joe Duarte
In The Money Options
Joe Duarte is a former money manager, an active trader, and a widely recognized independent stock market analyst since 1987. He is author of eight investment books, including the best-selling Trading Options for Dummies, rated a TOP Options Book for 2018 by Benzinga.com and now in its third edition, plus The Everything Investing in Your 20s and 30s Book and six other trading books.
The Everything Investing in Your 20s and 30s Book is available at Amazon and Barnes and Noble. It has also been recommended as a Washington Post Color of Money Book of the Month.
To receive Joe’s exclusive stock, option and ETF recommendations, in your mailbox every week visit https://joeduarteinthemoneyoptions.com/secure/order_email.asp.


