Connect with us

Hi, what are you looking for?

The Independent TradersThe Independent Traders

Stock

Unlocking the Power of Technical Indicators

In this edition of StockCharts TV‘s The Final Bar, Dave breaks down the chart of Intel Corp (INTC) to demonstrate the benefits of three important technical indicators: Moving Averages, Relative Strength Index (RSI) and Relative Strength. He shares why a disciplined process of interpreting these indicators can help investors better understand price action, along with how to set up this layout on the StockCharts platform.

This video originally premiered on January 23, 2024. Watch on our dedicated Final Bar page on StockCharts TV!

New episodes of The Final Bar premiere every weekday afternoon. You can view all previously recorded episodes at this link.

You May Also Like

World News

NEW YORK — An appellate judge on Thursday temporarily lifted a limited gag order issued against Donald Trump and his attorneys in the $250...

Stock

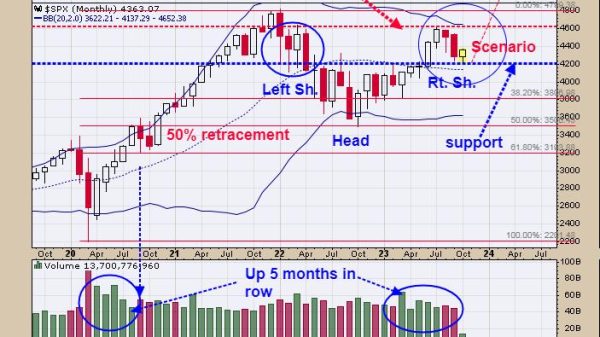
SPX Monitoring Purposes: Long SPX 9/28/23 at 4299.70. Gain since 12/20/22: 15.93%. Monitoring purposes GOLD:  Long GDX on 10/9/20 at 40.78. Above is the monthly...

Business

Many of the core issues in the labor dispute between the United Auto Workers and the Big Three U.S. automakers are familiar: salary increases,...

Business

Union members at Ford, Stellantis and General Motors have ratified a new 4½-year contract, locking in at 11% pay increases secured after a six-week...