“We are in the business of making mistakes. Winners make small mistakes. Losers make big mistakes.” — Ned Davis
There are zillions of cliches that paraphrase what Ned Davis said. The umbrella axiom with your portfolio should be to cut your losers.
Nude investing is what I label an investor without a formalized selling methodology. I refer to myself as a rational investor, and by that I mean I blend fundamental analysis (particularly earnings) with my technical analysis tools. Doesn’t that seem reasonable or rational? Well, having a specific sell methodology is both rational and necessary.
Not to name names, but I’ve witnessed numerous prominent fundamentally-oriented money managers preaching to individual investors how complex investing is, and, for this reason alone, investors cannot possibly succeed on their own, but should therefore entrust their assets to these fundamentalist managers. Oftentimes, the parallel sermon is that charts and technical analysis is just “hocus-pocus”.
I will concede that, on the buy side, sound fundamentals certainly increase the probability of a profitable investment. On the sell side, it’s tomfoolery for these same fundamentalists to claim this as gospel, because the majority of these same money manager preachers are closet chartists. Shocking, but true. Yes, they use charts to decide when to sell. The reality is that your wealth will get destroyed if you use only fundamentals in your selling methodology. Fundamentals are always late to the sales party. Your charts are real-time.
Sell based on the charts. It’s the foundation of profitable investing. You’ll learn “why” weeks or months after the equity has drifted lower and lower. Once again, sell based on the charts and ask questions later. Protect your profits at all costs. Get your ego out of the way.
As Ned Davis said, we are in the business of making mistakes. It’s to be expected. Just make certain they are small mistakes. Isn’t this a life lesson as well?
So how do you make these SMALL mistakes? To that end, I’ll present four examples of “wealth destroyers” most investors are familiar with. I’ll show you how applying my 3-Peaks selling methodology would have saved your kit and caboodle. In the selling chapter of our book (Tensile Trading), we refer to it as the Beginner’s Sell Methodology. It has three major advantages: it’s simple, it’s clear, and it works.
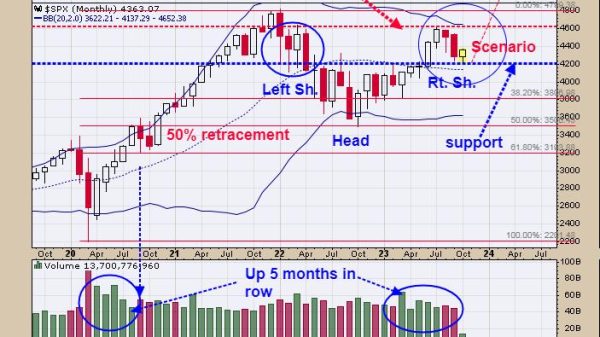
Here’s the discipline. When an equity makes a new price high, followed by a pullback, and then the next rally in price fails to take out or exceed the previous high in price, we then have in place 2-Peaks. Yellow flags go up at this point because the second peak is lower than the first peak. Subsequently, a red flag goes up when we have a second pullback, followed by a third peak which is even lower than the previous two peaks. This show of weakness and lessening demand for the equity is your red flag signal to get your finger on the sell trigger. Look at the charts below — LUMN, AIG, Citigroup and Walgreens — and this will make sense.
Lumen Technologies (LUMN)
American International Group (AIG)
Citigroup (C)
Walgreens Boots Alliance (WBA)
In a famous interview that Paul Tudor Jones did with Tony Robbins, the Market Wizard famously said that the key to his success was his ability to play defense and get out of losing positions in a timely manner. Paul Tudor Jones had unbelievable success in managing money. He told his college students that one of his key metrics was the 200-Day Moving Average, but we’ll go into that in my next blog. I’ll close with a quote from another great Market Wizard (see Jack D. Schwager’s books on Market Wizards published by John Wiley & Sons), in which Stanley Druckenmiller maintained that “A big part of my process is taking signals from markets. I’ve always believed markets are smarter than I am.” To this, I would add the caveat that charts don’t lie. Learn to trust them.
So here’s your homework for next time. Go to StockCharts.com and the Predefined Scans. Find 50 equities making new lows. Go backwards in time and look at their charts when the equity peaked. Then look for two subsequent lower peaks and identify the point at which you would have sold it. Trust me — this will be an hour of power for you. The insights will be well worth your time!
As you do these exercises, try to get into the mindset that the market is selling you clues. The more clues you buy, the lower the price and the lower your profits. Depending upon the specific equity, these chart clues accumulate in different timeframes. Nevertheless, these little red flags will raise their little red heads — some more quickly than others, which is another clue unto itself about the seller’s urgency. But usually, the 3-Peaks will be clearly visible. When you see the 3-Peaks pattern, don’t just sit there frozen like a deer in the headlights waiting for the apocalypse. This is your call to action.
Remember that profits are the result of two decisions. You can buy wrong and still make money. You can’t make money if you sell wrong. Avoiding financial face-plants is an investment discipline embraced by all the Market Wizards. You need to join the club!
“Markets are never wrong, only opinions are.” — Jesse Livermore


