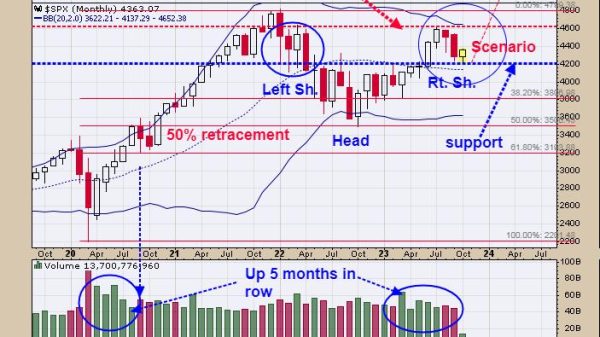
In this exclusive StockCharts video, Julius shares a new approach to seasonality by using a more granular, data-set constructed UDI (User Defined Index) for every sector. Using the UDI functionality on StockCharts.com allows Julius to plot the seasonal patterns for each sector forward to the end of 2025 and overlay the current chart to spot (dis)alignments.
This video was originally published on February 4, 2025. Click on the icon above to view on our dedicated page for Julius.
Past videos from Julius can be found here.
#StayAlert, -Julius


